In a Nutshell
A wellness web platform that visualizes emotions as 3D planets. Users record emotion level, reason, and diary in three steps, then track emotional patterns through a calendar and charts. AI predicts emotions and provides period-based analysis.
Emotion Recording
Data Visualization
AI-Powered Analysis
- Reduced triangles by 88% and achieved 29fps to 61fps through GLSL shader simplification and LOD Subdivision.
- Achieved 58% reduction in First Load JS by restructuring Barrel Exports and applying Dynamic Import.
- Designed a pnpm monorepo architecture where Next.js web app and Chrome Extension share 3D planets, clock, and theme.
The emotion planet was heavier than the service itself.
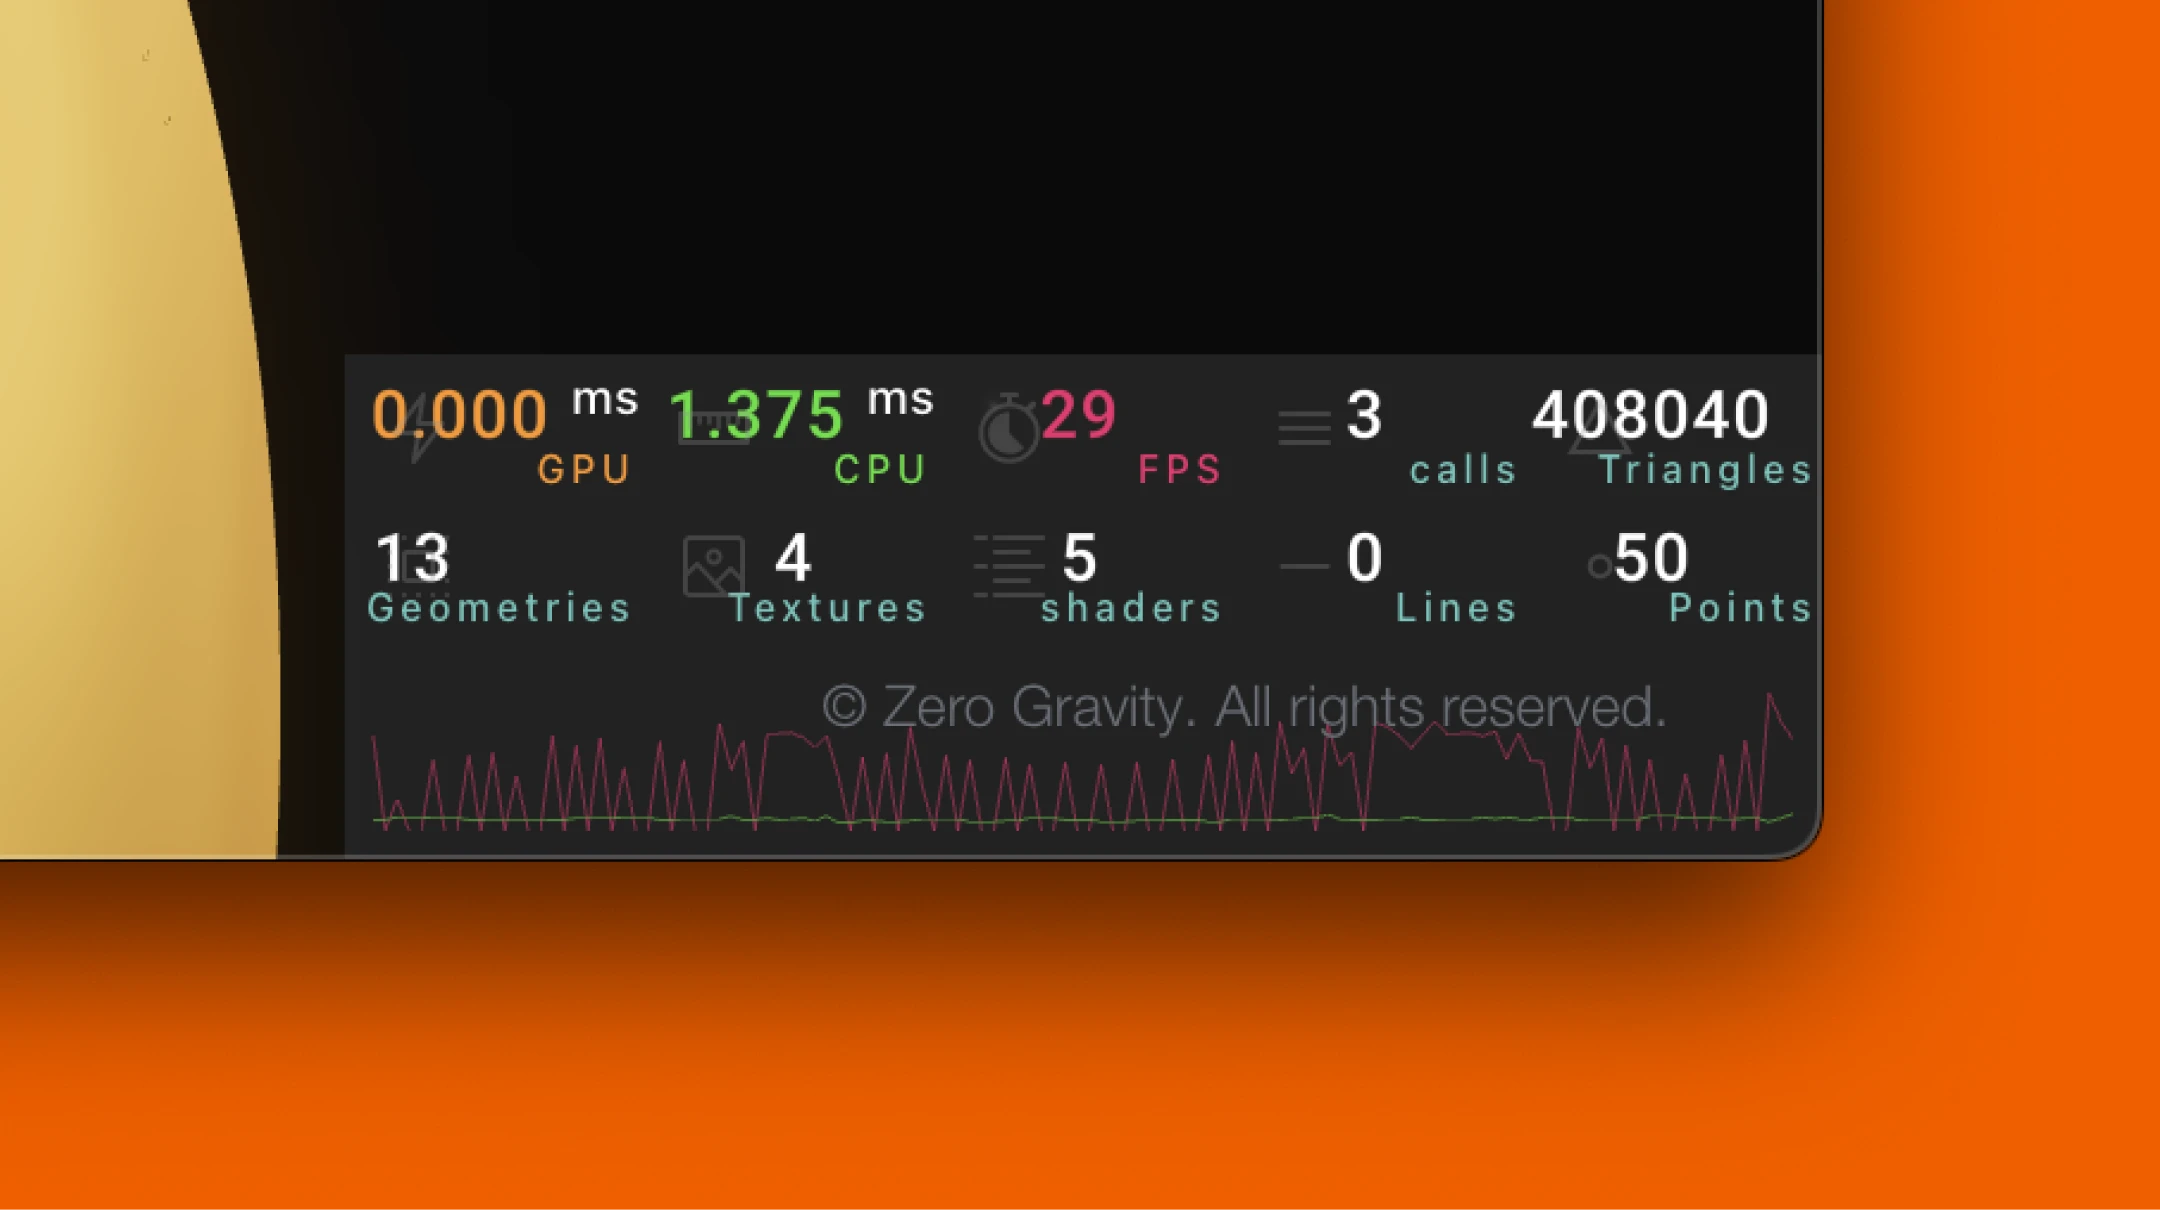
Measured with r3f-perf: 408,040 triangles, frame rate at 29fps.
Zero Gravity is a service where an emotion planet greets you every time you open a new tab. A heavy screen on a daily page meant a heavy first impression of the service.
What if the values were pre-baked?
Instead of computing noise every frame, what if pre-computed values were stored in a texture and sampled from it? The first attempt was VAT(Vertex Animation Texture).
VAT failed, but testing it revealed that the existing shader's computation load was excessive. This led to a fundamental question: "Is this computation actually necessary?"
Found the unnecessary computation.
Quantifying the shader's computation cost told the full story.
The shader was originally designed for a sphere with organically undulating surfaces. To deform the surface:
- Displace each vertex position using noise (a math function that generates natural patterns)
- Compute 4D noise twice inside the noise function for more dynamic patterns
- Since positions change, normals for lighting must be recalculated, requiring 2 neighboring vertices to be computed as well = 3 calls total
4D noise x2 per call x 3 calls x 102,000 vertices = ~610,000 noise calls per frame
The original intent was to express emotional intensity through surface undulation, but looking at the planet's form, the key visual was color patterns flowing across the surface, like Jupiter or Neptune. Emotions were already conveyed without surface deformation.
The unnecessary computation was removed, keeping only the color animation.
Reduced per-vertex cost. Now for the vertex count.
Per-vertex noise was reduced, but with 102,000 vertices, that was still ~200,000 noise calls per frame.
The triangle count of IcosahedronGeometry scales with the square of subdivision.
subdivision 100 → 408,040 triangles
Since the planet fills the entire screen on the main page, low subdivision made the surface look faceted. It was pushed to 100 for quality, but the performance trade-off wasn't considered.
Finding the minimum subdivision that maintained visual quality led to applying LOD(Level of Detail). Smaller planets could go lower without noticeable difference, and mobile screens are smaller, so they could go even lower.
* 408,040 includes the shadow pass. The actual triangle count for subdivision 100 was about 204,000, but the shadow pass rendered the same geometry again, doubling the count. It was an unnecessary shadow in a bottomless space, so it was removed.
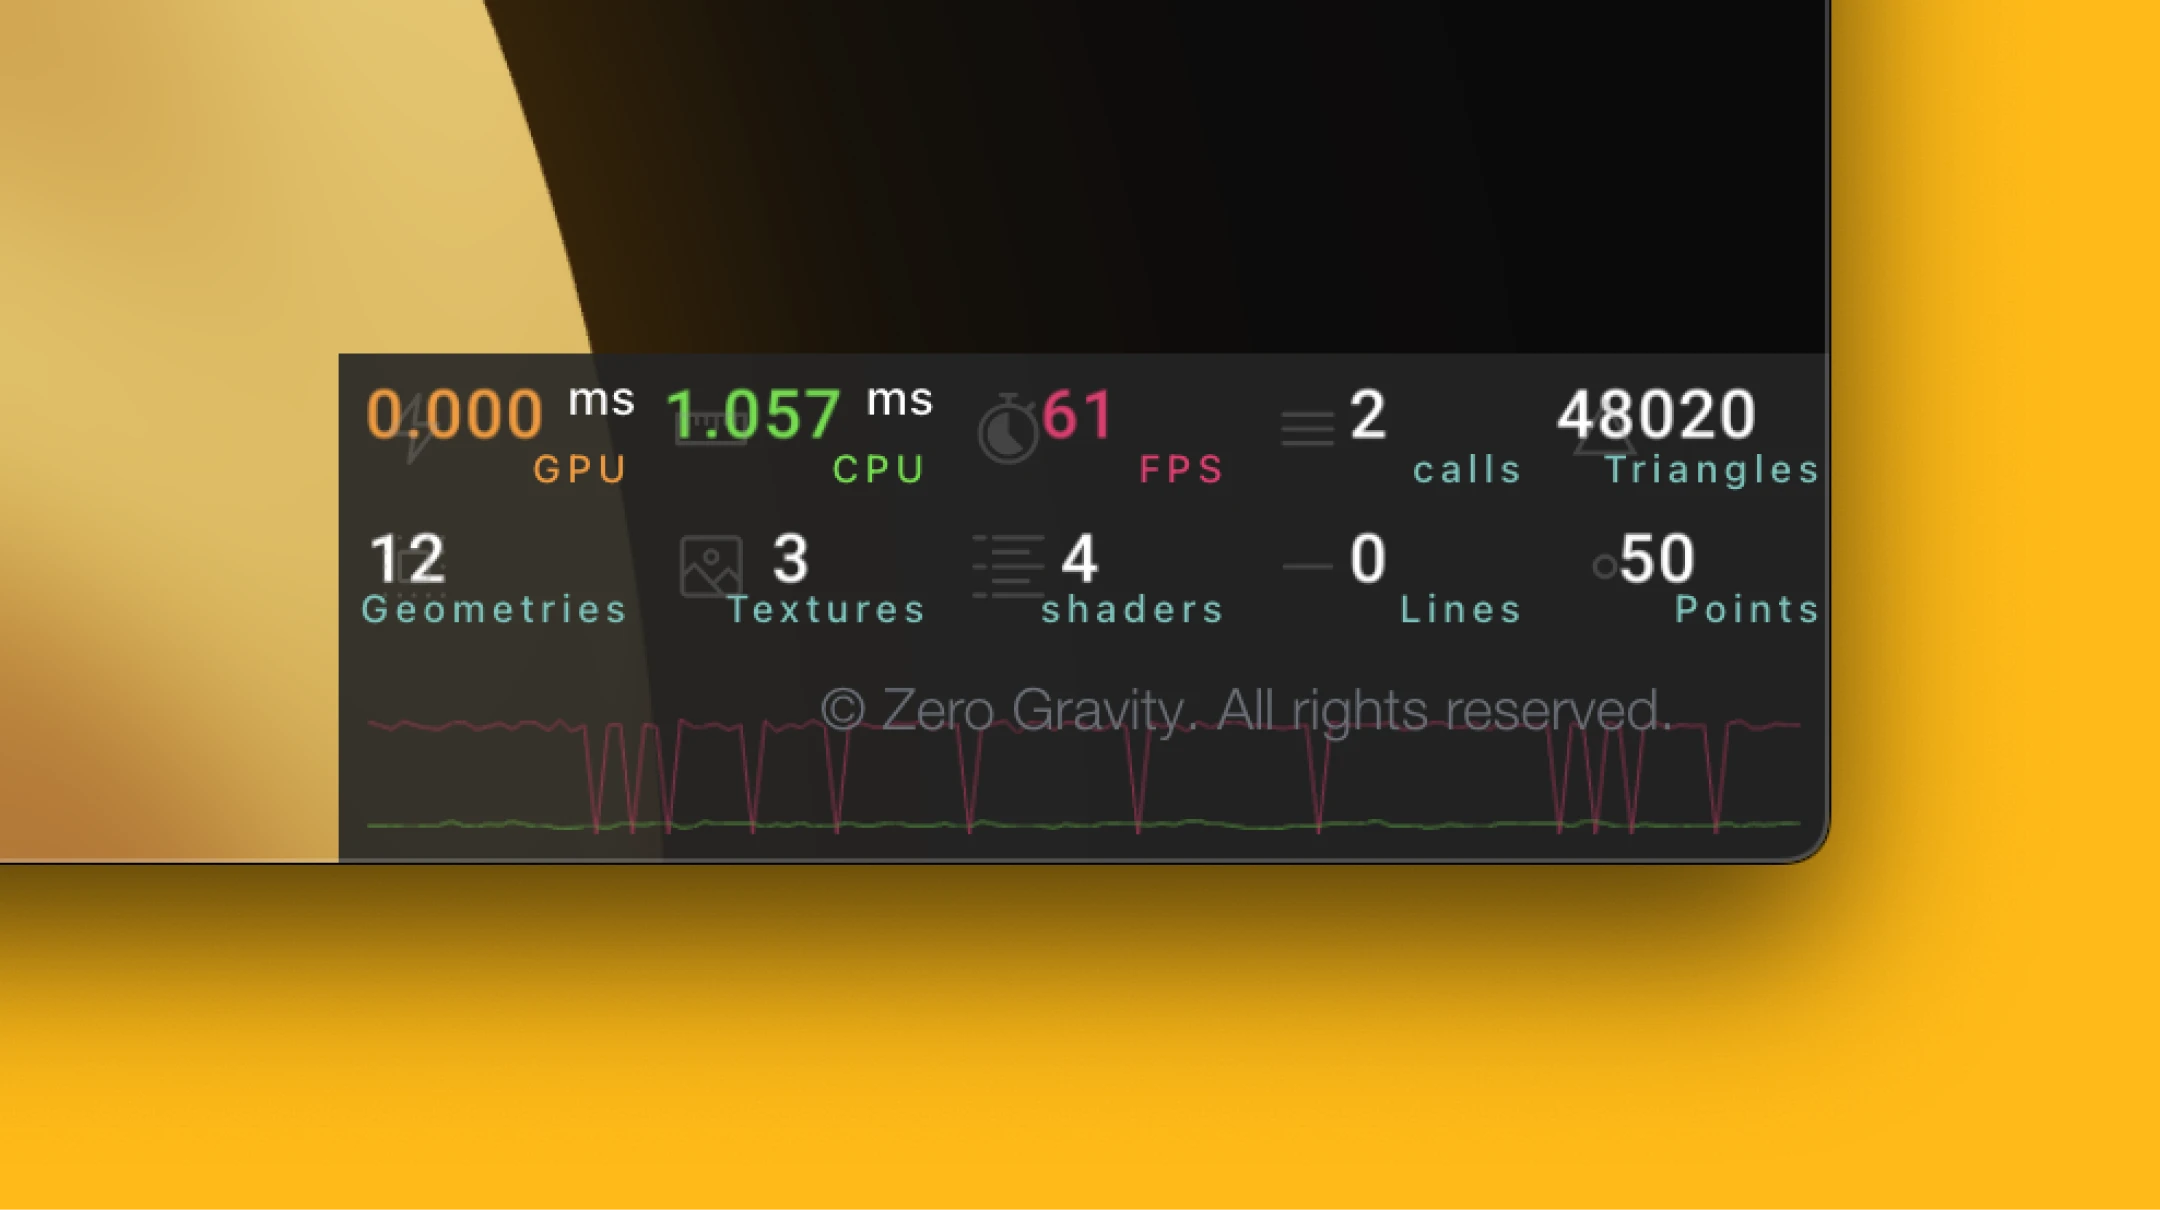
4D noise x2 per call x 1 call x 24,000 vertices = ~48,000 noise calls per frame
29fps → 61fps
Reducing 610,000 noise calls per frame to 48,000 wasn't about adopting new technology. It was about finding and removing unnecessary computation. There's no single right answer to optimization, but asking "is this really needed?" was the most effective starting point.
Why was Three.js on the chart page?
The cause was the Barrel Export structure.
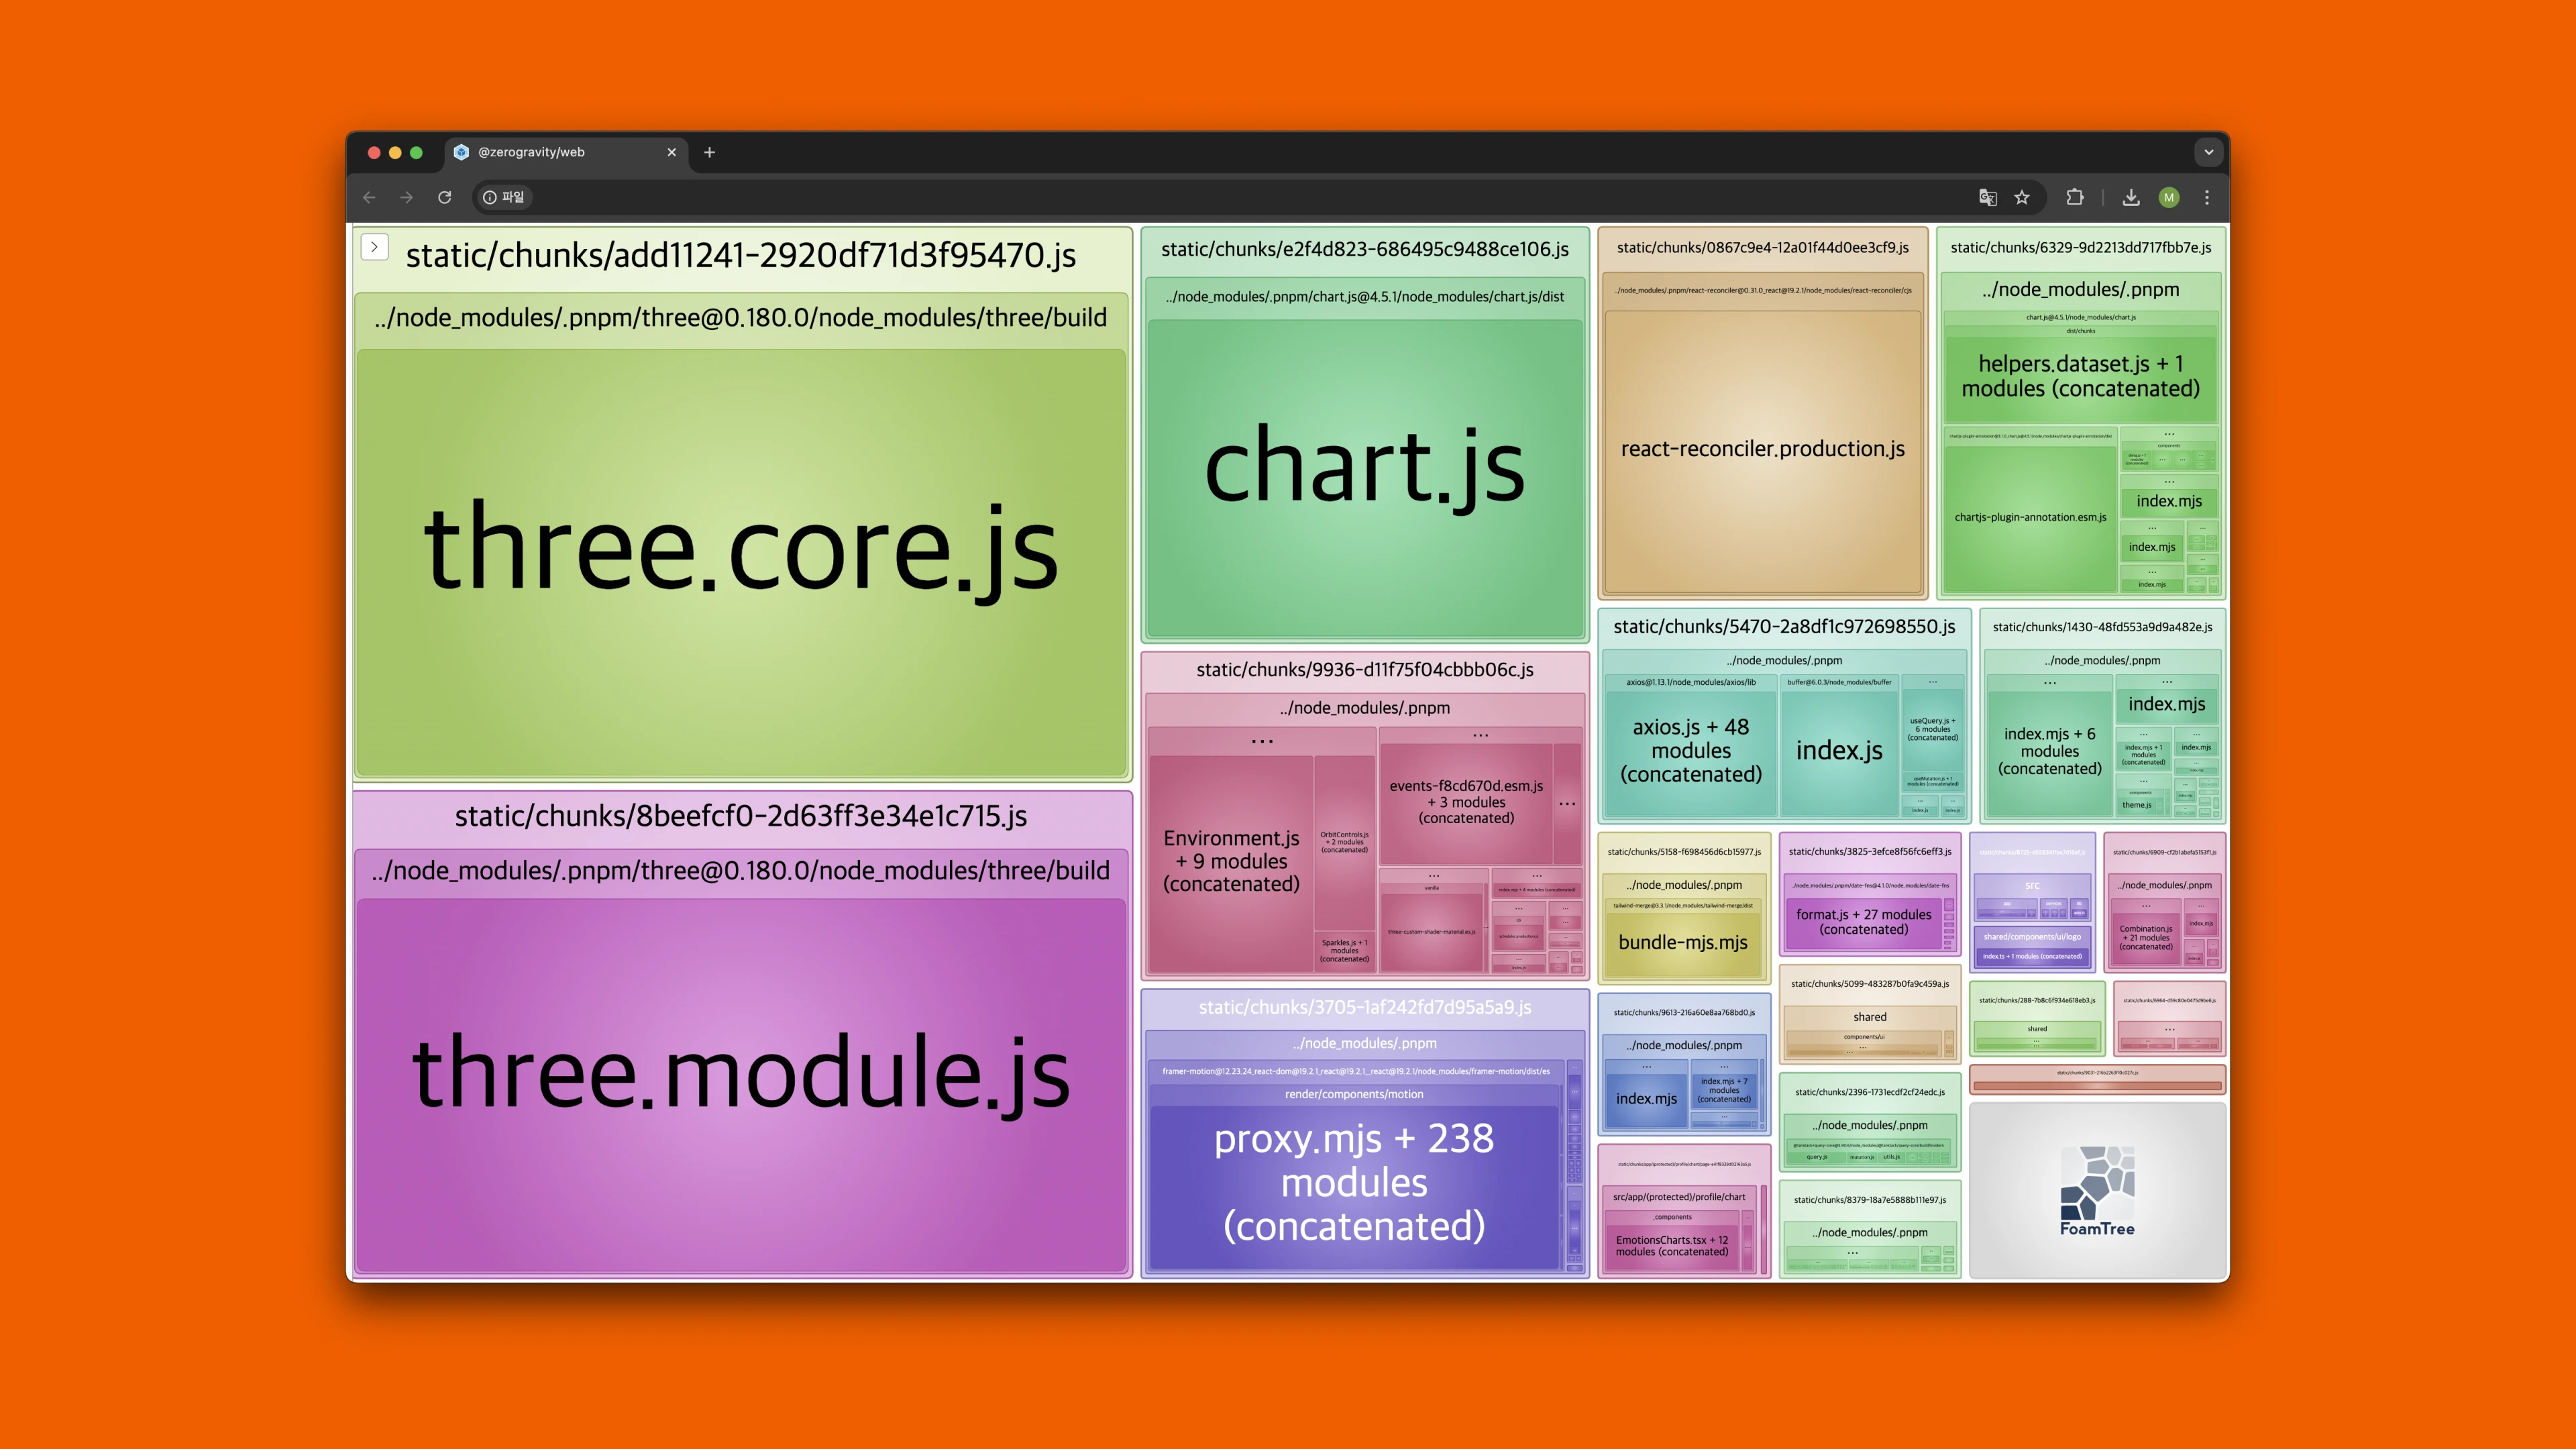
Bundle analysis with @next/bundle-analyzer showed Three.js taking up 712KB, about 35% of the entire bundle, and First Load JS reaching 447KB for Home and 514KB for Record.
Three.js seemed like the culprit. Splitting components with Dynamic Import, extracting only needed modules with Custom Exports, and individual drei imports were all attempted. None of them worked.
Then something strange appeared. Three.js was included on the chart page, which didn't use any 3D at all.
The chart page only imported pure constants like color mapping (EMOTION_COLORS_MAP) and labels (EMOTION_TYPES), but since they were bundled in the same barrel as the 3D component, the entire 712KB of Three.js came along.
How the 712KB was cut.
Emotion-related constants and types (EMOTION_STEPS, EMOTION_COLORS, EMOTION_TYPES, etc.) served as the domain data hub across the project. Sliders, forms, calendars, charts, and Chrome Extension totaling about 28 files imported this data.
The problem was that this domain data was bundled in the same barrel as the 3D planet component in the monorepo shared package. In a monorepo, the shared package is consumed as pre-built, so the barrel boundary becomes the chunk boundary, which becomes the limit of bundle optimization.
Splitting barrels by dependency weight was the structural solution. This separated "what" an emotion is (name, color, value) from "how it's rendered" (3D mesh, shader).
Three.js components were lazy-loaded with React.lazy. Since both web and Chrome Extension share the shared package in the monorepo, the framework-agnostic React.lazy was chosen over the Next.js-specific next/dynamic.
The problem after bundling.
The bundle was halved, but users still faced 2-3 seconds of loading screen.
Even after JS arrives, the 3D scene must go through WebGL initialization, environment map loading, and shader compilation before rendering. Reducing the bundle didn't shorten this process.
The solution was restructuring so the planet was visible immediately, even before the 3D scene loaded.
- Separated only the Canvas as lazy load, rendering the Container immediately to secure layout space and prevent CLS
- 21 static placeholder images per emotion (7 emotions x 3 sizes), so the planet appeared instantly during 3D loading
First Load JS -58%
The process started without knowing the cause, inspecting pages one by one, tracing the structure, and even after cutting the bundle in half, when loading still remained on the user's screen, digging deeper. Optimization was about looking one more time when it seemed done.
The goal was to show 3D planets in the Chrome Extension.
But Chrome Extension doesn't support SSR, so Next.js couldn't be used directly.
The vision was an entry point where the emotion planet appeared the moment a new tab opened, so users could record and check emotions faster every day. To deliver the same experience across web and Extension, there had to be a way to share core UI components between the two environments.
A monorepo was chosen to keep the strengths of each environment: Next.js (SSR) and Vite (Extension), while enabling code sharing.
pnpm Workspace 3-Package Structure
The shared package is built with Vite library mode, and both web and extension import from it. Using Chrome Cookies API to check for the NextAuth session cookie and delegating verification to the NextAuth session endpoint, logging in once on the web automatically authenticated the Extension as well.
Analyzing shader code, tracing the bundle, designing the monorepo were all for the same reason. So that when users open a new tab and use the service, they can meet their emotion planet quickly and naturally.